A radon mitigation system was installed and the homeowner assumed it was handling the problem. The fan was running, annual inspections were completed, the system looked fine. But our continuous radon data revealed two distinct and measurable forces working against that mitigation system - forces that don't show up unless you're watching continuously.
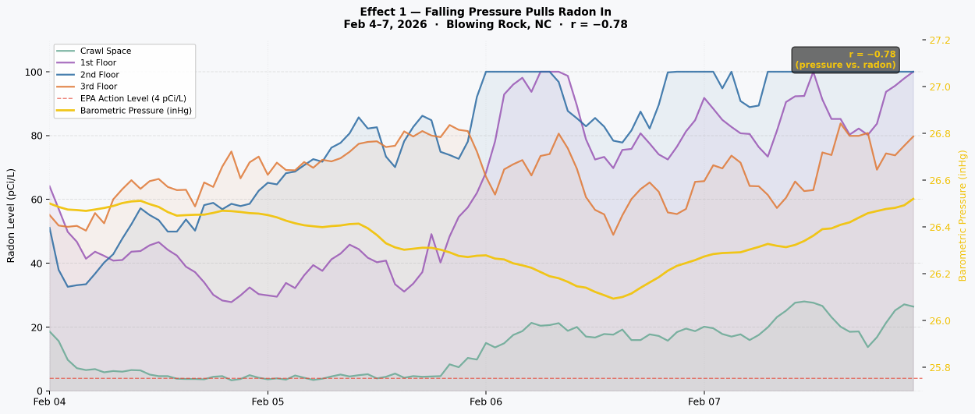
The first force: barometric pressure. Between February 4 and 7, 2026, as a storm system moved through the region, barometric pressure dropped steadily from 26.67 to 26.06 inHg at the property. Radon across every living level climbed in near-perfect lockstep. The correlation coefficient between pressure and radon during that 72-hour window was −0.78, a strong, statistically significant inverse relationship. When atmospheric pressure drops, the pressure difference between the soil beneath the home and the air inside increases. Radon that would otherwise move slowly gets pulled in faster, and if the mitigation fan isn't sized to overcome that increased differential, a system that works fine on a calm day falls behind every time a storm approaches.
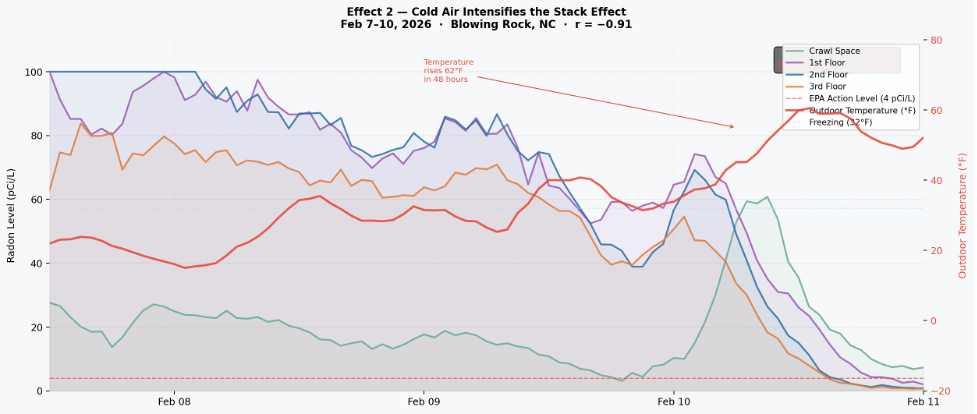
The second force: outdoor temperature. Between February 7 and 10, 2026, temperatures at the property swung nearly 62°F in 48 hours — from single digits to above 60°F. As the temperature rose, radon fell sharply across all three living levels. The correlation between outdoor temperature and radon during that window was −0.91, the strongest relationship in three months of data. Cold outdoor air creates a powerful temperature differential between the soil and the living space, intensifying the stack effect that draws radon upward through the home. The colder it is outside, the harder that mitigation fan has to work - and the more radon concentrates in the spaces where your family spends their time.
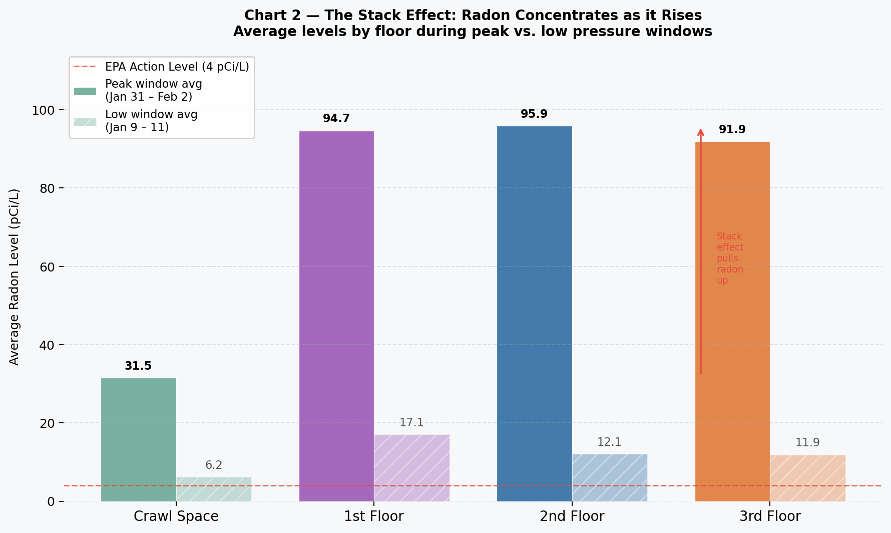
These two forces often arrive together. A winter storm brings falling pressure and cold temperatures simultaneously, which is exactly what happened during the January 31 – February 2 peak when living levels in this home averaged 93–96 pCi/L — nearly 24 times the EPA action level — for 48 straight hours.
This is also where single-point testing creates a dangerous blind spot. Most homeowners test in the basement — the logical choice, since that's where radon enters. But the stack effect means living levels and upper floors can accumulate higher concentrations than the basement itself. During the peak window, the crawl space averaged 31.9 pCi/L while the living levels were running at 3x that.
A basement reading that looks acceptable may be masking a worse problem one floor up, in the spaces where your family lives. This homeowner's radon fan was not ready for the pressure and temperature differentials their mountain home actually experiences in winter.
So we recommended two things: knowing that your radon fan can operate with the actual pressure differential your home experiences during storm events, and a continuous radon monitoring on each occupied level. The basement tells you where radon is coming from. The living level tells you what your family is breathing. And continuous data tells you when the conditions that defeat your mitigation system have arrived - before another week goes by undetected. We also have the option for monitoring your radon fan as well, ensuring that it’s on and working and even watching its power load to determine if its performance is degrading or if failure looks imminent.
Recommendations
1. provide data and discuss radon mitigation with qualified professional
2. install continuous radon monitoring on all levels
3. monitor the power on the radon fan to ensure it continues to operate as expected